
PROGOS® Part4(Graphics Presentation)のテンプレートや採点基準は、以前のブログでまとめました。
型はわかった。
あとは実際に練習して自分の実力を確かめたい!
という人に向けて、今回は筆者(PROGOS受験経験者)が本番形式に合わせて作成したオリジナルのグラフ問題を使いながら、CEFRレベル別の模範回答を紹介します。
PROGOSのPart4は、テンプレートを覚えた後の実践量がスコアを左右するパートです。
この記事では、A2(High Beginner)/B1(Intermediate)/B2(Advanced)の3段階で、そのまま音読して練習できる回答例を掲載しています。
本記事の内容は、公式ガイドではなく、PROGOSを複数回受験しB2以上を取得した筆者の実体験に基づく解説です。実際の試験で感じたポイントや、回答の質を高めるために意識すべき点を中心にまとめています。
前回の復習|PROGOSグラフ説明の万能フレーズ
以下は、今回の回答例でも頻出のキーフレーズです。

模擬問題と回答例
以下の模擬問題と回答例は、筆者が、実際の試験形式に合わせて作成したオリジナル問題です。
公式問題ではありませんが、実際の出題傾向に沿って構成しています。
本番と同じく、40秒で準備してから60秒間スピーキングしてみましょう。
模擬問題①|通勤手段の割合(Tokyo / Nagoya)
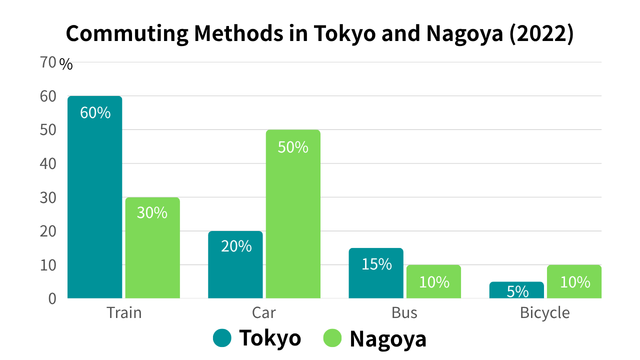
2022年の 東京と名古屋の通勤手段(Train / Car / Bus / Bicycle) の割合を示した棒グラフです。
PROGOS形式の問題文

40秒準備メモ
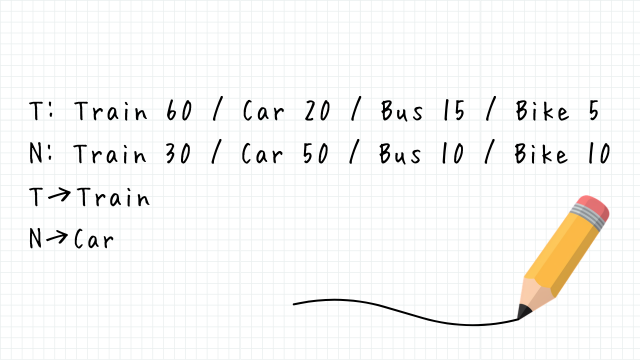
これだけで60秒話せます。
模範回答①|A2(High Beginner)
短く・正確に・数字をそのまま読む構成です。
【回答例】
This graph shows the commuting methods in Tokyo and Nagoya in 2022.
In Tokyo, trains account for the largest share at 60%.
Cars are 20%, buses are 15%, and bicycles are the lowest at 5%.
In Nagoya, cars are higher than any other method at 50%.
Trains are 30%, and buses and bicycles are both 10%.
Overall, Tokyo uses trains the most, and Nagoya uses cars the most.
模範回答①|B1(Intermediate)
比較表現+流れの良い接続詞がポイント。
【回答例】
This graph shows the commuting methods used in Tokyo and Nagoya in 2022.
In Tokyo, trains account for the largest share at 60%.
Cars follow at 20%, buses at 15%, and bicycles remain the lowest at 5%.
In contrast, Nagoya shows a different pattern.
Cars are higher than trains, making up 50%, while trains account for 30%.
Buses and bicycles each represent 10%.
Overall, Tokyo is train‑oriented, while Nagoya is car‑oriented.
模範回答①|B2(Advanced)
分析・理由付け・まとめの構成が高スコアの鍵です。
【回答例】
This graph shows the distribution of commuting methods in Tokyo and Nagoya in 2022.
I will summarize the key differences between the two cities.
In Tokyo, trains account for the largest share at 60%, indicating a strong dependence on public transportation.
Cars make up 20%, buses 15%, and bicycles remain very low at 5%.
Nagoya presents a contrasting trend.
Cars account for the largest portion at 50%, which is significantly higher than Tokyo.
Trains represent 30%, while buses and bicycles each remain stable at 10%.
Overall, Tokyo is clearly train‑focused, whereas Nagoya is car‑dependent.
In summary, the two cities show distinct commuting preferences shaped by their infrastructure.
模擬問題②|平均気温(Tokyo / Osaka)
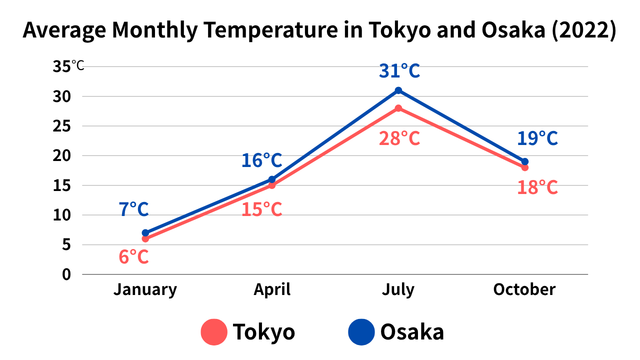
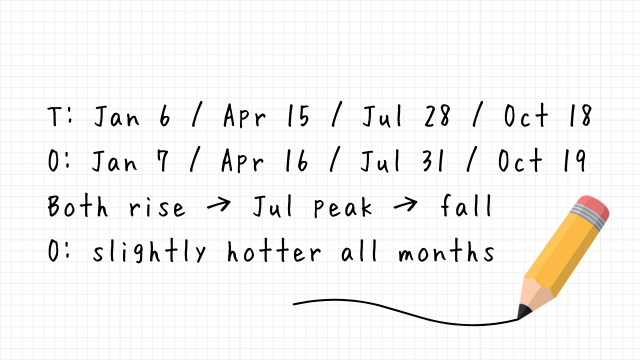
2022年の 東京と大阪の平均気温(1月・4月・7月・10月) を示した折れ線グラフです。
PROGOS形式の問題文
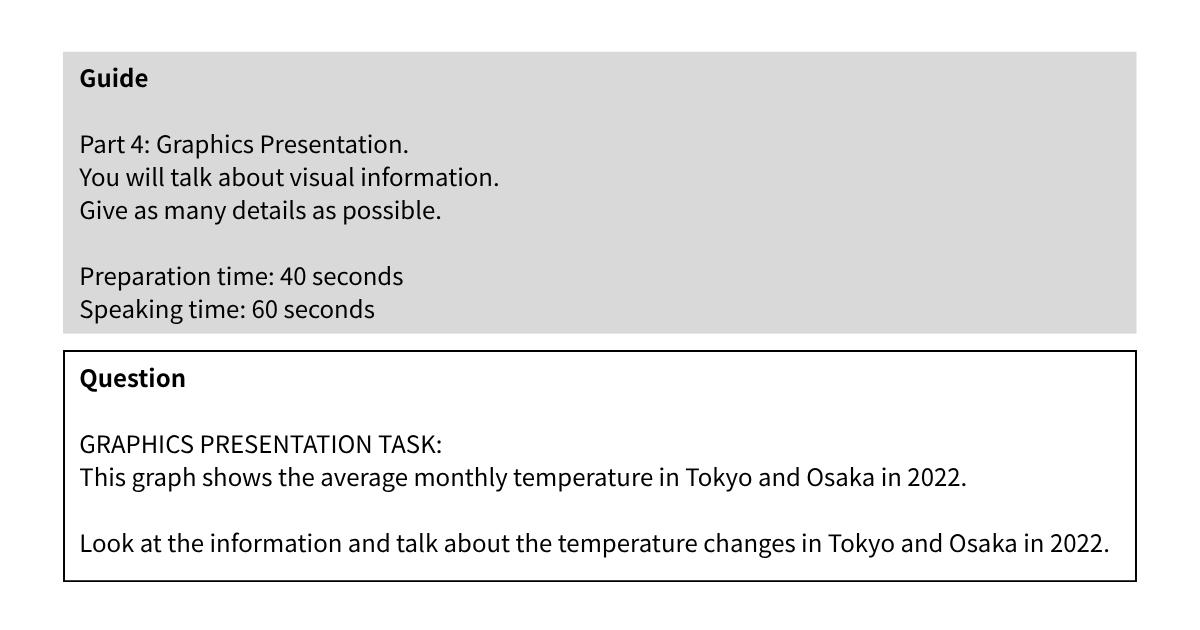
40秒準備メモ
模範回答②|A2(High Beginner)
数字を正確に読む+季節の流れを一言でまとめました。
【回答例】
This graph shows the average monthly temperature in Tokyo and Osaka in 2022.
In January, Tokyo is 6 degrees and Osaka is 7 degrees.
In April, Tokyo is 15 degrees and Osaka is 16 degrees.
In July, the temperature peaks, with Tokyo at 28 degrees and Osaka at 31 degrees.
In October, Tokyo is 18 degrees and Osaka is 19 degrees.
Overall, both cities get warmer until July and then get cooler again.
Osaka is slightly higher in every month.
模範回答②|B1(Intermediate)
slightly / peak / increase / decrease などの動きを表す語を入れると一気にB1らしくなります。
【回答例】
This graph shows the average monthly temperature in Tokyo and Osaka in 2022.
In January, temperatures are low, with Tokyo at 6°C and Osaka slightly higher at 7°C.
By April, both cities increase to around 15–16°C.
The temperature peaks in July, reaching 28°C in Tokyo and 31°C in Osaka.
In October, temperatures decrease again to 18°C and 19°C.
Overall, both cities follow the same pattern, but Osaka remains slightly higher throughout the year.
Auntie
6°C は英語で “six degrees Celsius” と読みます。
模範回答②|B2(Advanced)
トレンド→比較→まとめの3段構成を意識してみました。
【回答例】
This line graph shows the average monthly temperature in Tokyo and Osaka in 2022.
I will highlight the main trends and compare the two cities.
Both cities start at low temperatures in January, with Osaka slightly higher at 7°C compared to Tokyo’s 6°C.
Temperatures increase steadily toward April, reaching 15°C in Tokyo and 16°C in Osaka.
The hottest point occurs in July, when temperatures peak at 28°C in Tokyo and 31°C in Osaka.
After July, temperatures decrease and remain stable around the high‑teens in October.
Overall, the two cities show similar seasonal patterns, but Osaka is consistently higher across all months.
In summary, Osaka maintains slightly warmer conditions throughout the year.
PROGOS Part4で高スコアを狙うポイント
PROGOSは情報を整理して伝える力を見るテストです。
テンプレート+練習問題を繰り返すことで、確実にスコアが伸びますよ。


ほぼ日々英語管理人レイジーれいじのおばAuntieです。
現役英会話講師。英検1級。TOEIC975点。れいじの学習を応援中です。
Loose Drawing|無料で商用利用可能なフリーイラスト https://loosedrawing.com/