
これまで本ブログでは、PROGOS® の Part 4「グラフィックを用いたプレゼン」で使える便利なフレーズやテンプレートをたくさんご紹介してきました。
フレーズは覚えたけれど、実際の試験で使えるか不安…
もっと色々なパターンの図表やグラフで実践練習がしたい!
そんな皆さんの声にお応えして、今回は完全オリジナルの予想問題を4問作成しました。
本番と同じ準備40秒/発話60秒のタイマーをセットして、これまでに学んだ表現を思い出しながらぜひ挑戦してみてください。
各問題の後には、目標スコア(CEFR A2〜B1)に合わせた2レベル分の回答例と、スコアアップのための実践テクニックも掲載しています。
本記事に掲載している問題は、過去の出題傾向を元に筆者が独自に作成したオリジナル予想問題です。PROGOS®の公式問題ではありませんので、日々のスピーキング練習・実力試しとしてご活用ください。
PROGOS Part 4(グラフ・図のプレゼン)基本ルールと採点基準
すべての問題において、出題条件は共通です。
まずはスピーキングの基本の流れを頭に入れておきましょう。
- 準備時間: 40秒
- 発話時間: 60秒
- 評価のポイント: 単なる数字の読み上げではなく、ビジュアル情報をできるだけ詳しく、比較や変化(増減)交えて論理的に説明すること。
PROGOS Part 4 予想問題&レベル別回答例(全4問)
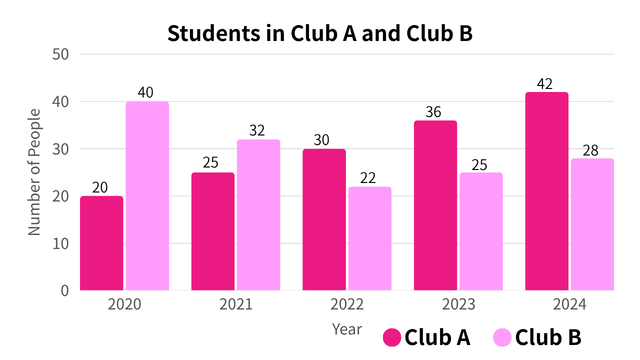
【第1問】2つのクラブの部員数(折れ線グラフを想定した問題)
Question
GRAPHICS PRESENTATION TASK:
The graph shows the number of students in Club A and Club B from 2020 to 2024.
Look at the information and talk about the number of students in both clubs.
シンプル回答例
【回答例】(まずはここから!A2目標)
This is a graph about students in Club A and Club B.
In 2020, Club A had 20 students and Club B had 40 students.
Club A was lower than Club B.
In 2022, Club A had 30 students and Club B had 22 students.
Club A was higher than Club B.
In 2024, Club A had 42 students and Club B had 28 students.
Club A was higher than Club B.
I think this is good, because more students join Club A every year.
応用回答例
【回答例】(表現を豊かに!B1目標)
This graph shows the number of students in Club A and Club B from 2020 to 2024.
Overall, Club A increased every year, and Club B decreased and then increased slightly.
In 2020, the number of students in Club A was lower than that of Club B.
After 2021, Club A had more students than Club B.
The number of students in Club A increased from 20 to 42.
Club B decreased from 40 students to 22 students in 2022, and then increased to 28 students in 2024.
In summary, Club A became more popular, and Club B had fewer students over time.
スコアアップの実践テクニック①|重要データに絞る
実際の試験で「60秒でどう話せばいいかわからない…」という方は、以下のポイントを意識してみてください。
すべてのデータを言わなくてもOK!
グラフの数値を最初から最後まで全部説明しようとすると、確実に時間が足りなくなります。
大切なのは「一番高い/低いデータ」や「変化が大きい部分」を絞ること。
今回の問題では、Club A と Club B の人数が逆転した「2021年〜2022年のタイミング」や、最終年である「2024年の数値」を中心に話すだけで十分高評価が狙えます。
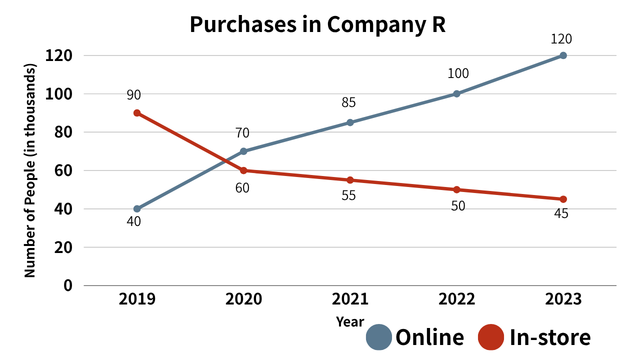
【第2問】オンライン vs 店舗の購入数(複合・時系列グラフを想定した問題)
Question
GRAPHICS PRESENTATION TASK:
The graph shows the number of online and in‑store purchases in Company R from 2019 to 2023.
Look at the information and talk about the changes and differences between online and in‑store purchases over these five years.
シンプル回答例
【回答例】(まずはここから!A2目標)
This is a graph about purchases in Company R.
I can see Online and In‑store purchases.
It is shown in thousands of people.
In 2019, Online is 40 thousand and In‑store is 90 thousand.
Online is lower than In‑store.
In 2020, Online is 70 thousand and In‑store is 60 thousand.
Online is higher than In‑store.
I think this is good, because more people can buy easily from home.
応用回答例
【回答例】(表現を豊かに!B1目標)
This graph shows the number of online and in‑store purchases in Company R from 2019 to 2023.
Overall, online purchases increased, while in‑store purchases decreased.
In 2019, online purchases were 40 thousand, and in‑store purchases were 90 thousand.
Online was lower than in‑store.
After 2020, online became higher than in‑store.
Online increased steadily every year and reached 120 thousand in 2023.
In‑store purchases decreased from 90 thousand to 45 thousand.
In summary, online shopping became more popular, and fewer people bought things in stores.
スコアアップの実践テクニック②|話すスピードに合わせる
英語を話すスピードは人それぞれです。
タイムアップが不安な方は、自分のペースに合わせて情報の量を調整してみましょう。
ゆっくり丁寧に話すタイプの方は…
今回のシンプル回答例のように、2019年(スタート)と2020年(逆転の年)など、2〜3年のポイントにグッと絞り、確実に文章を言い切ることを目指しましょう。
テンポよく話せるタイプの方は…
今回の応用回答例のように、全体のトレンド(Online が増えて In-store が減った)を述べた上で、それぞれの最終的な数字(120 thousand / 45 thousand)まで肉付けしていくと、高スコア(B1以上)に繋がりやすくなります。
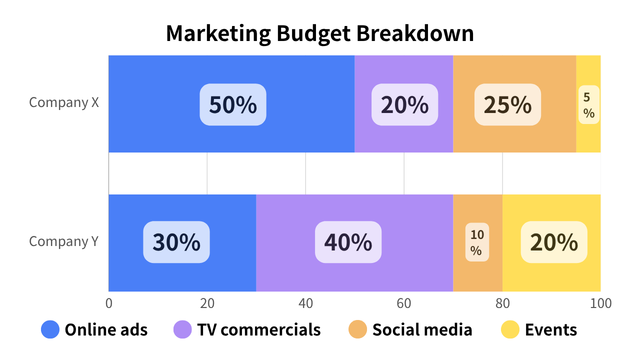
【第3問】2社のマーケティング予算比較(複数棒グラフを想定した問題)
Question
GRAPHICS PRESENTATION TASK:
The bar chart shows how Company X and Company Y divide their marketing budget into different categories.
Look at the information and talk about the differences in how the two companies use their marketing budget.
シンプル回答例
【回答例】(まずはここから!A2目標)
This is a graph about marketing budget.
I can see Online ads. Company X is 50%, and Company Y is 30%.
I can see TV commercials. Company X is 20%, and Company Y is 40%.
I can see Social media. Company X is 25%, and Company Y is 10%.
I can see Events. Company X is 5%, and Company Y is 20%.
Online ads for Company X is higher than Company Y.
Social media for Company X is higher than Company Y.
I think this is good, because we can see the difference.
応用回答例
【回答例】(表現を豊かに!B1目標)
This graph shows the marketing budget breakdown of Company X and Company Y.
Overall, Company X spends more on online ads and social media, while Company Y spends more on TV commercials and events.
Online ads account for the largest share for Company X at 50%, while Company Y spends only 30%.
On the other hand, TV commercials are higher for Company Y at 40%, compared to 20% for Company X.
Social media is also higher for Company X at 25%, while Company Y spends only 10%.
For events, Company Y is 20%, and Company X is 5%.
In summary, Company X focuses on digital marketing, while Company Y invests more in traditional media and events.
ワンポイントアドバイス|中学英語レベルで十分通用する!
今回の応用回答例(B1目標)のような比較問題を聞くと、「ビジネス英語が必要なのでは?」と難しく感じるかもしれません。
使っている単語はすべて中学英語レベルです。
難しい言葉で複雑に説明しようとするよりも、「全体のトレンド(Overall)を言う」「一方では(while )でつなぐ」といった、これまでに本ブログで紹介したテンプレートの型にしっかり当てはめて話すことが、PROGOS で高スコアを出すための最短ルートです。
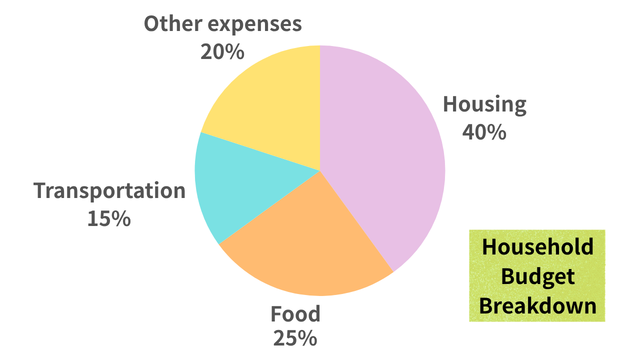
【第4問】家計の支出割合(円グラフ想定)
Question
GRAPHICS PRESENTATION TASK:
The pie chart shows how a typical household divides its monthly budget into four categories.
Look at the information and talk about how the household spends its money.
シンプル回答例
【回答例】(まずはここから!A2目標)
This is a graph about household budget.
I can see Housing, Food, Transportation, and Other expenses.
Housing is 40%.
Food is 25%.
Transportation is 15%.
Other expenses are 20%.
I think this is good, because we can see how people spend money.
応用回答例
【回答例】(表現を豊かに!B1目標)
This graph shows how a household spends its monthly budget.
Overall, housing accounts for the largest share at 40%, followed by food at 25%, other expenses at 20%, and transportation at 15%.
Housing is higher than all other categories.
Food is the second largest, while transportation is the smallest.
In summary, most of the household budget goes to housing and food, showing that living costs are the biggest part of spending.
筆者の一言|円グラフの出題について
実はこれまで本番で円グラフに出合ったことは一度もないのですが、絶対に出ないとは言い切れません。
本番でどんな図表が来ても焦らないよう、お守り代わりにぜひ練習しておいてください。
まとめ|テンプレートの型を覚えたらあとは繰り返し練習!
今回の PROGOS Part4 オリジナル予想問題はいかがでしたか?
この2つを意識するだけで、60秒間の使い方がガラリと変わり、タイムアップや沈黙の不安がグッと減るはずです。
本番の試験で焦らず実力を発揮できるよう、今回ご紹介した回答例を何度も口に出して練習してみてください。
あわせて読みたい!これまでのPROGOSグラフ問題対策記事
「もっと基礎から型の使い方をマスターしたい!」「さらに上のB1・B2レベルを狙える表現を身につけたい!」という方は、ご自身のレベルや目的に合わせて以下の過去記事もぜひチェックしてみてください!
英語に少し自信がない・まずは型をカチッと固めたい方へ
☞ 【PROGOS®対策】Part4グラフ問題は中学英語で一発攻略!初級向け裏ワザ型
「1分間沈黙してしまう…」という初級者の方はまずこの記事から!
ビジネス英語を一切使せず、中学英語のテンプレートだけで乗り切る4つの魔法のステップを徹底解説しています。
☞ 初心者必見!PROGOS(R)のグラフ問題対策に使える覚えておきたい表現
準備時間40秒で焦らないための鉄板フレーズ集!
単語を入れ替えるだけでどんなグラフにもすぐに応用できる、初心者向けの便利なテンプレートを紹介しています。
どんなグラフが来ても対応できる万能の「型」が知りたい方へ
☞ PROGOS®Part 4対策|どんなグラフも使い回せる万能型テンプレ
本番で焦りたくない方必見!
PROGOS テストで B2+ を取得した筆者が、どんなテーマのグラフや図が来ても1本で使い回せる最強の構成テンプレートと、スコアを安定させる増減の英単語を伝授します。
☞ PROGOS®グラフ対策|模擬問題とCEFR別回答例【A2/B1/B2】
別のパターンでもっと問題演習をしたい方へ。
筆者オリジナルの予想問題に加えて、A2レベルからB2レベルまでのステップアップ回答例を詳しく解説しています。
さらなる高スコア(B1〜B2以上)を目指す中級者の方へ
☞ PROGOS(R)のグラフ問題対策にも使える!グラフを説明する英語表現【中級者向け】
ただ数字を追うだけの説明から卒業したい方へ。
単調な英語から抜け出し、ビジネスシーンでも使えるグラフを論理的に説明するフレーズを例文付きで紹介しています。
☞ 英語でグラフを説明する具体的なフレーズ10選!比較・要約をカバー【中級者向け】
PROGOS の評価項目である比較・要約を強化するならこれ!
グラフの本質をスマートに伝えるための、実用的な中級フレーズを10個厳選して分かりやすく解説しています。

ほぼ日々英語管理人レイジーれいじのおばAuntieです。
現役英会話講師。英検®1級。TOEIC®990点。れいじの学習を応援中です。
Loose Drawing|無料で商用利用可能なフリーイラスト https://loosedrawing.com/